
🚀 Motivation
Waymo is rapidly expanding across the United States, rolling out autonomous ride-hailing services in city after city. The ambitions are bold — but what does it take to realistically meet urban demand with autonomous vehicles?
This blog post explores how ride-hailing simulations with MATSim DRT Contrib can help cities, mobility strategists, and tech companies estimate the fleet size required to serve real-world demand. By simulating autonomous deployments, we gain actionable insights into what a Waymo-like service would need to operate effectively in a new urban environment.
One city stands out: Chicago. The City of Chicago provides a highly detailed, continuously updated ride-hailing dataset — a true hidden gem that’s often overlooked in both academic and commercial circles. It offers a rare opportunity to analyze real booking behavior at scale.
In this post, I’ll show you how to unlock the full potential of this dataset using Java, Python, MATSim, and Simunto software. We’ll dive deep into the data and explore how simulation can turn raw demand into strategic deployment decisions.
📦 Input Data: Real Ride-Hailing Trips from Chicago
The foundation of this analysis is a public dataset provided by the City of Chicago, titled Transportation Network Providers - Trips (2025). It contains anonymized trip-level data from ride-hailing services like Uber and Lyft, and is published under Public Domain — making it freely usable for both academic and commercial purposes.
You can access the data in two ways:
- CSV Archive Download: A full-year dump, currently around 12.5 GB of raw data for 2025.
- API Access: Ideal for downloading specific days or weeks without handling the full dataset.
You can get a full overview of the provided attributes per trip check out this source. The so call PlansConverter allows you to download and cache files day by day. Moreover, trip demand gets transformed to MATSim compatible input.
⚠️ Working on 12.5 GB csv can be a significant hurdle. That’s why I’ve created a PlansConverter that lets you fetch data for selected days or entire weeks with ease. You need to register in order to obtain an API token for my downloader.
📍 Scope of Analysis: Intra-Chicago Trips Only
It’s important to note that pickup and dropoff coordinates are omitted whenever a trip starts or ends outside the official boundaries of the City of Chicago. In such cases, fields like census tract, community area, and geolocation are left blank.
As a result, this analysis focuses exclusively on trips that both start and end within Chicago city limits. This ensures that all trips included in the simulation have valid spatial references and can be accurately mapped and analyzed. Origin and destination coordinates are represented by the census tract centroid. I created a census tract coordinate sampler that draws random start and end coordinates within each tract area.
By restricting the dataset to intra-city trips, we can:
- Reliably reconstruct origin-destination flows
- Analyze demand patterns across community areas
- Simulate realistic operations within a well-defined urban service area
This scope also mirrors how autonomous ride-hailing services like Waymo typically operate — starting with clearly bounded service zones before expanding to broader regions.
📊 A Typical Week of Ride-Hailing in Chicago
Before diving into the simulation study, let’s take a moment to explore the data. For this, I downloaded a typical week of ride-hailing activity in Chicago via API access, covering the period from June 2 to June 8 2025.
This week includes a total of 888,610 trips.
🗺️ Spatial Distribution
The spatial distribution of trips is shown in the image below:
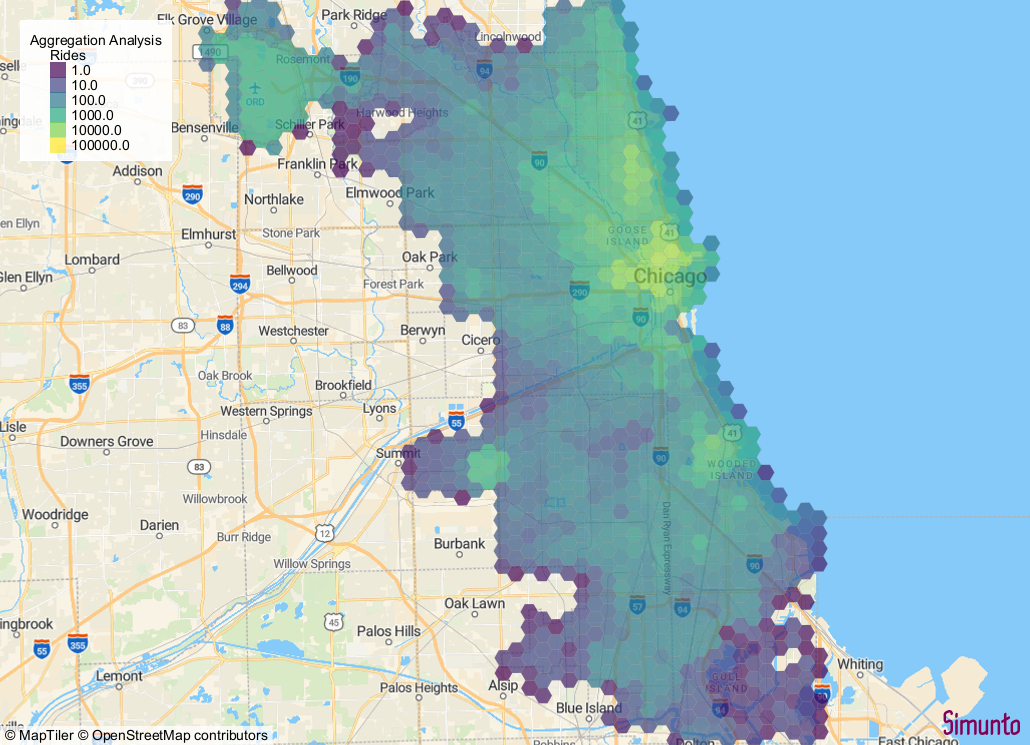
As expected, demand hotspots include the downtown area and especially the airports, which show consistently high ride volumes.
📐 Trip Distance Behavior
To better understand how far people travel, I visualized the distribution of trip distances:
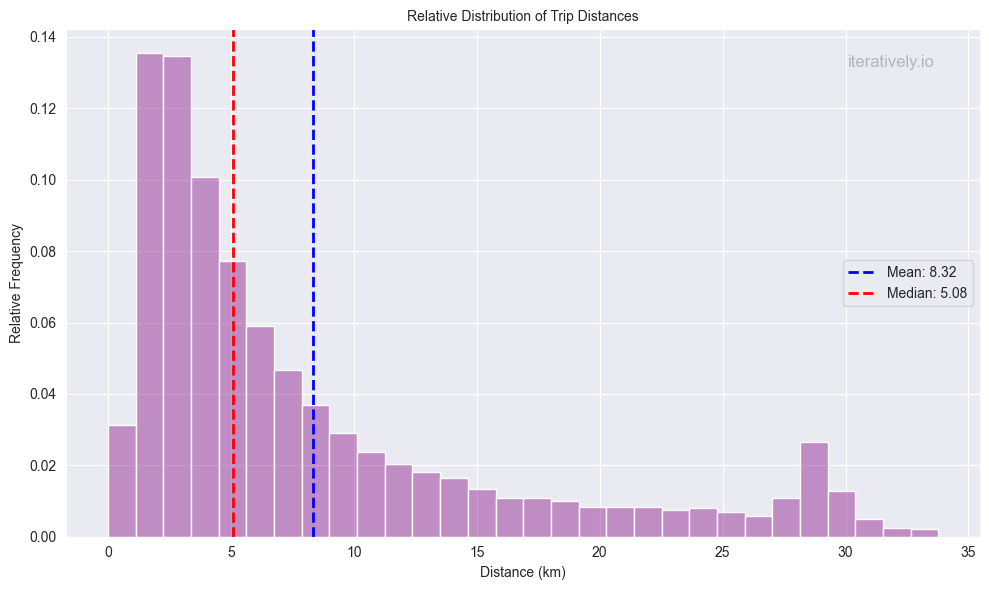
As someone who prefers walking as little as possible, I was surprised — or maybe not — to see that the American stereotype holds true: even the shortest distances, often less than 2 km, are frequently covered by ride-hailing services.
That said, it’s worth considering that nighttime safety concerns may also play a role in this behavior, encouraging people to opt for a ride rather than walking through the city.
💸 Tip Behavior Insights
Beyond trip volumes and distances, the dataset also offers valuable insights into tipping behavior — something that’s often overlooked in ride-hailing analyses. Since Waymo vehicles don’t receive tips, understanding where human drivers earn the most in gratuities can reveal potential pricing opportunities for autonomous fleets.
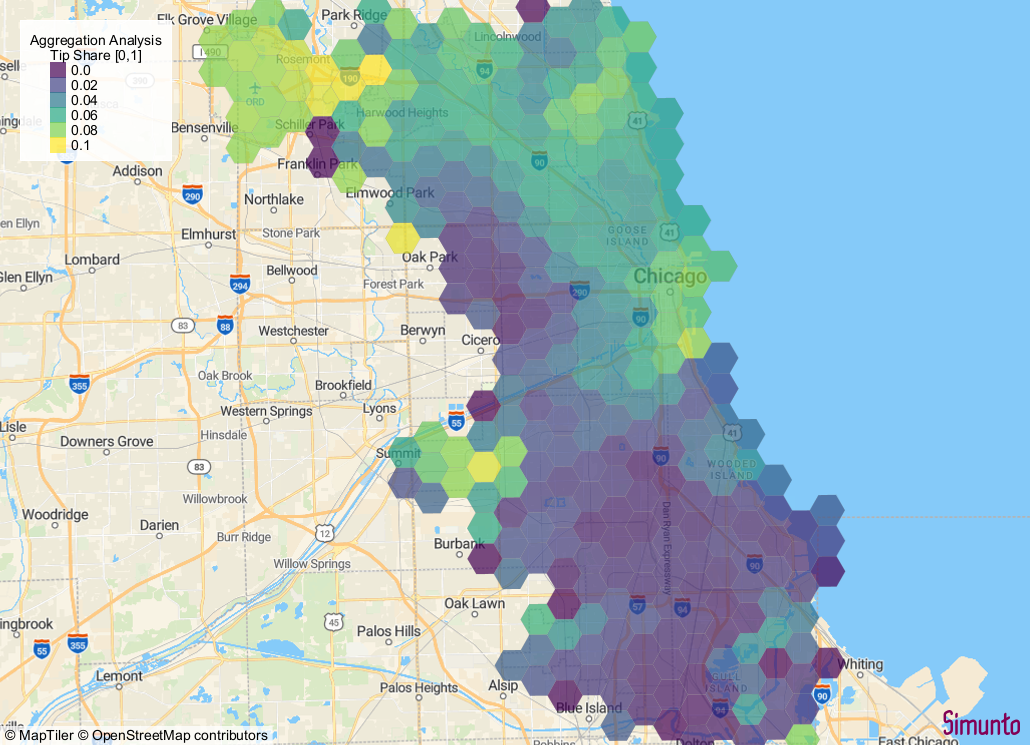
I visualized the spatial distribution of tip share, i.e., the proportion of the total fare that comes from tips. The results are intriguing:
- Airports stand out as areas where passengers tend to be more generous.
- Downtown and the northern parts of the city also show elevated tip shares.
This could imply that in these regions, Waymo might need to adjust pricing to compensate for the lack of tips — especially if competing with human drivers.
💬 If you’re familiar with Chicago’s neighborhoods and have a hypothesis about these patterns, feel free to share your thoughts with me on LinkedIn!
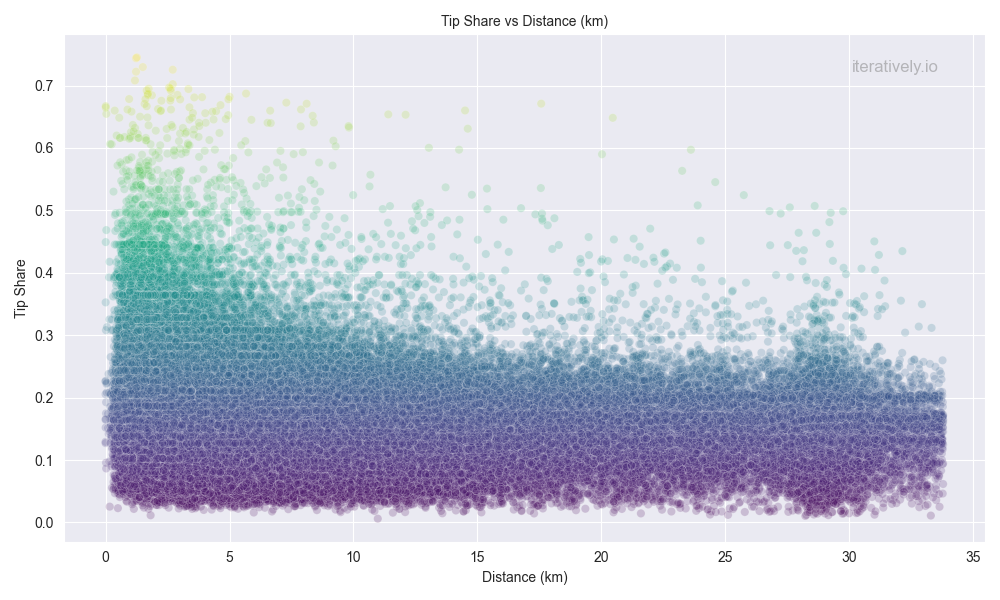
📏 Tip vs. Trip Distance
After this spatial analysis, I was hooked and eager to see what else the data might reveal. Another interesting finding: shorter trips tend to have proportionally higher tips than longer ones.
🔄 API Download Experience
One practical note: downloading this data via API was noticeably faster on weekends. During weekdays, the endpoint was heavily loaded and slow — something to keep in mind if you’re planning to automate data access.
🧪 Simulation Study: Building a MATSim Scenario from Real Ride-Hailing Data
Now comes the fun part — turning raw data into a working simulation. To do this, I’ve developed a modular pipeline using three key Java classes that together build a complete MATSim scenario from the Chicago TNP dataset.
⚠️ Disclaimer: A Simplified Simulation Perspective
This simulation study is a simplified exploration of autonomous fleet deployment using MATSim and real-world ride-hailing data. While it provides valuable insights into demand patterns and operational feasibility, it does not yet include several advanced modeling components that are essential for commercial-grade applications.
MATSim is capable of simulating much more complex systems, including:
- Operational Facilities: Hubs with charging infrastructure and parking space limitations
- Electric Vehicles (EVs): Including battery consumption models and charging behavior
- Service Tasks: Cleaning and maintenance
- Congestion Replication: Integrating congestion pattern from HERE or TomTom
These elements significantly increase the complexity of the model and are crucial when building simulations for real-world deployment, investment decisions, or regulatory planning.
💬 I’d love to hear your thoughts! Feel free to comment on this post or reach out via LinkedIn — let me know what you’d like to see covered in the next edition of this series.
🧱 Building the Urban Road Network (NetworkConverter)
This class downloads and processes an OpenStreetMap PBF file for the Chicago region. It clips the network to a bounding box, transforms coordinates to a local EPSG system, simplifies the network, and prepares it for DRT simulation by adding the necessary transport modes.
- Uses
SupersonicOsmNetworkReaderfor fast parsing - Applies
NetworkSimplifierto reduce complexity - Adds
drtmode to all car-accessible links - Outputs a clean MATSim network file (
network.xml.gz)
👥 Generating Agent Plans from Real Trips (PlansConverter)
This class connects to the City of Chicago’s TNP API, downloads trip data for a given date range, and converts each trip into a MATSim agent plan.
- Each trip becomes a
Personwith aPlan(home → drt leg → work) - Includes attributes like
fare,tip,trip_total, andshared_trip_match - Supports sampling and census tract-based coordinate generation
- Outputs
plans.xml.gzand a CSV summary of all trips
🧩 Orchestrating the Full Scenario (ScenarioCreator)
This is the master class that ties everything together. It sets up directories, calls the network and plans converters, and generates a full MATSim config.xml with all necessary modules.
- Configures DRT with advanced settings (e.g. parallel insertion, rebalancing, constraints)
- Generates a synthetic fleet (
fleet.xml.gz) based on network topology - Sets simulation time, scoring parameters, and zone systems
- Outputs a ready-to-run MATSim scenario with real-world demand
With this setup, you can simulate how an autonomous fleet like Waymo might perform in Chicago — using actual demand data, realistic routing, and configurable fleet behavior. Want to try it yourself? Try out the full code - If you need help. Feel free to reach out.
📈 Results: How Many Vehicles Would Waymo Need?
Almost like the cliffhanger in your favorite series — you’ve waited and wondered: How many vehicles would it take to serve all ride-hailing demand in Chicago with an autonomous fleet?
By gradually increasing the fleet size in simulation, we can estimate the number of vehicles required to keep the rejection rate (i.e., unserved trip requests) around 10%. The following plot shows that approximately 3500 vehicles are needed to meet this threshold during peak demand But that’s not the whole story. The utilization of the fleet is highly uneven across the week. Friday and Saturday evenings represent clear demand peaks, while the rest of the week shows significantly lower usage:
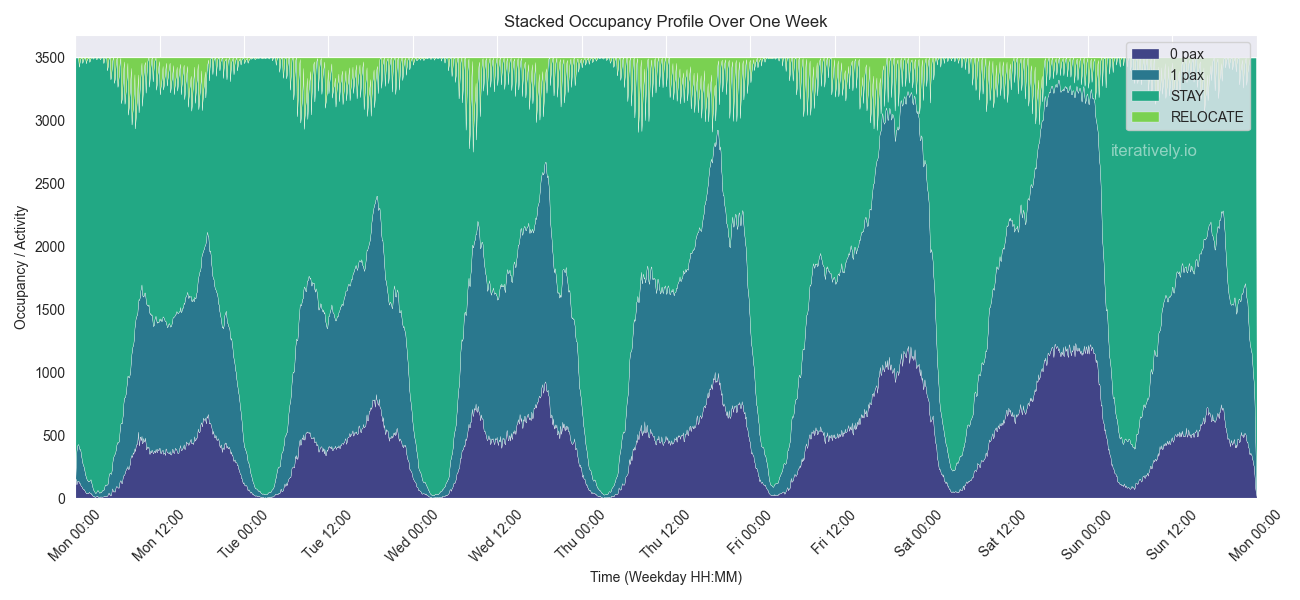
This utilization risk poses a serious economic challenge for autonomous operators like Waymo, Uber, or Lyft. Previously, this risk was absorbed by human drivers — now it shifts to the companies themselves.
It’s likely that these providers will aim for a hybrid operational model, where an autonomous fleet handles baseline demand and the human driven fleet is request only during high-utilization periods. This would help mitigate the risk of underused assets and ensure a more sustainable business case.
🔋 Battery Sizing & Daily Mileage: A Classic Question
One of the most frequently asked technical questions in autonomous fleet planning is:
How far does a vehicle need to drive per day?
To answer this, I ran a simple analysis based on the simulated weekly demand.
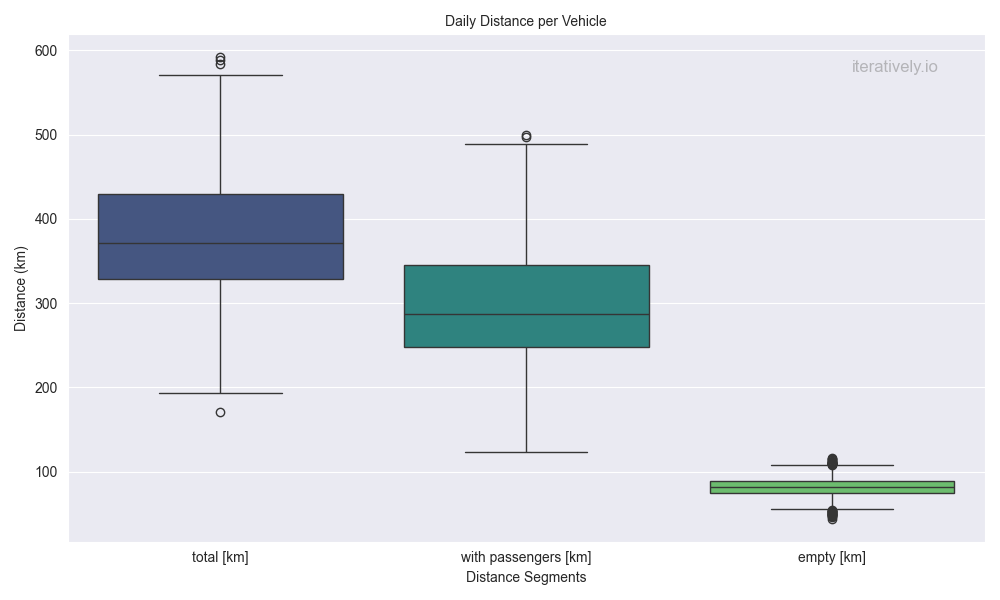
The simulation revealed a mileage of 350 km per day. Such a workload has direct implications for:
- Battery sizing
- Charging infrastructure
- Fleet rotation and maintenance cycles
Especially for electric vehicles (EVs), this level of daily mileage requires robust energy management and operational planning.
But it doesn’t stop at batteries:
🔧 Other wear components such as tires, brakes, and suspension systems must also be dimensioned appropriately. High daily mileage leads to increased wear, and frequent repairs can quickly result in:
- Higher operational costs
- Increased fleet size requirements (to compensate for downtime)
- Reduced economic viability
💬 What do you think? Share your thoughts or hypotheses on LinkedIn — I’d love to hear what you’d explore in the next edition!
Author: Steffen Axer